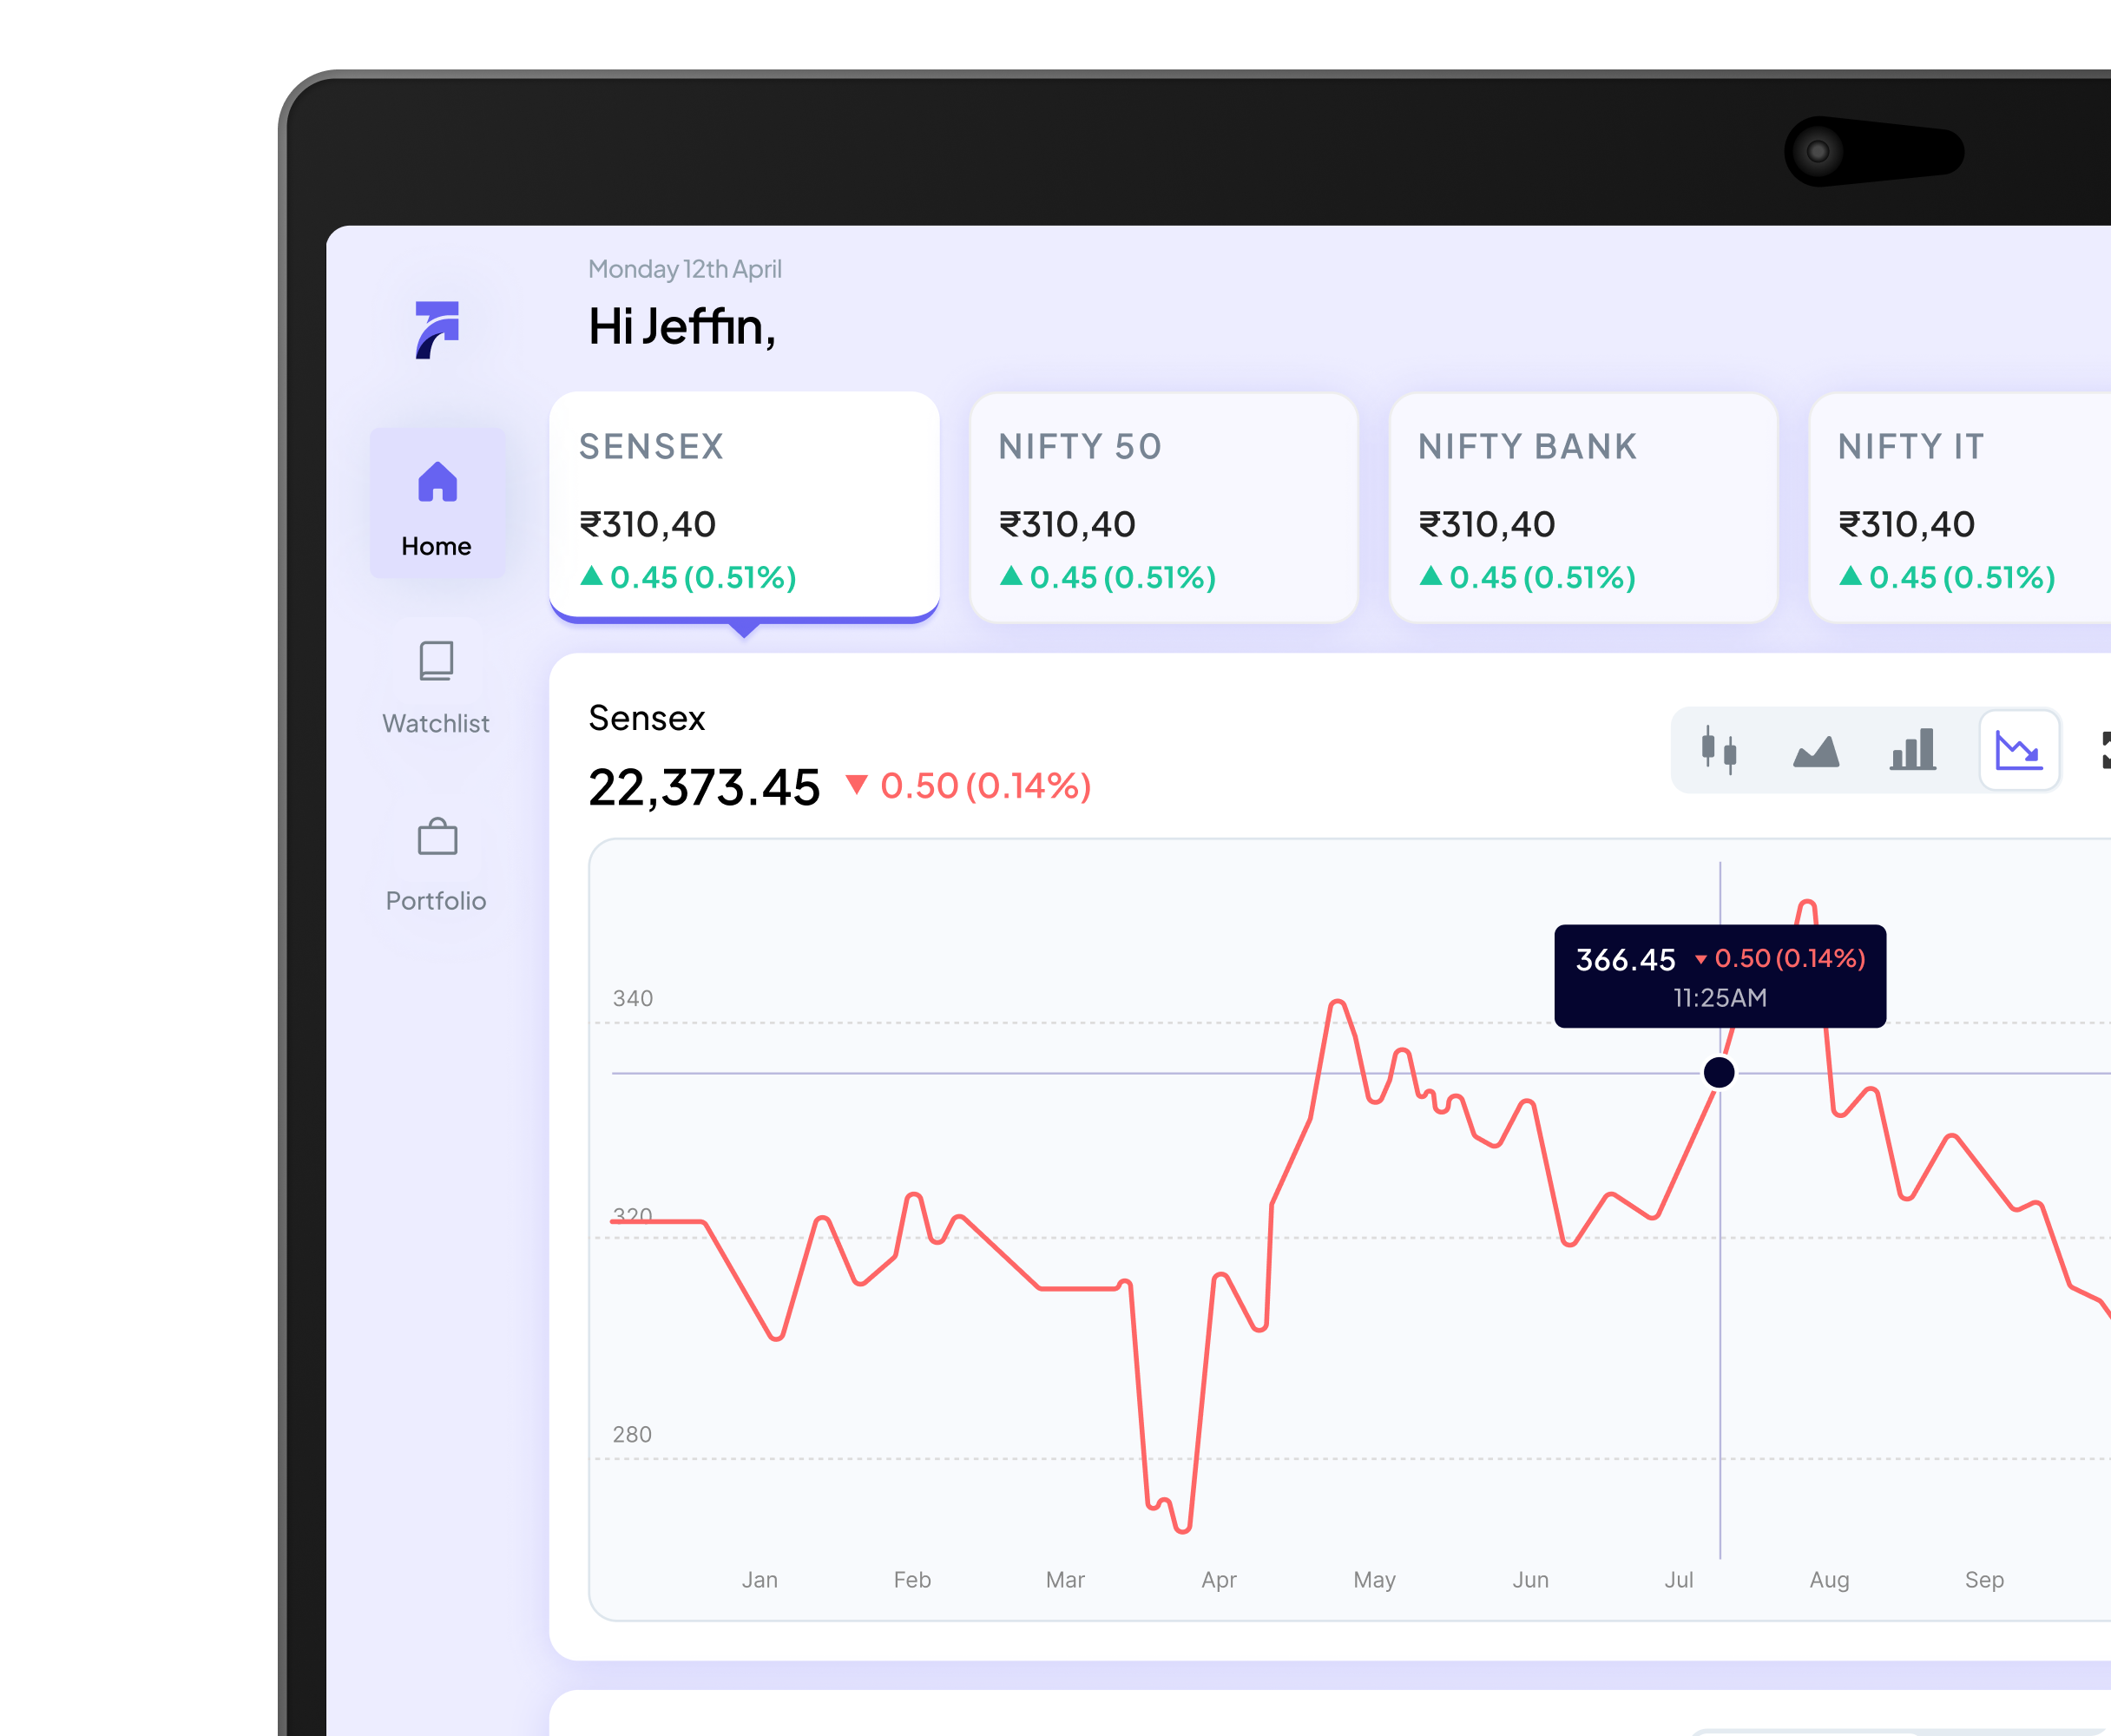
Quantitative Research is a structured research methodology that focuses on collecting and analyzing numerical data to uncover measurable patterns, trends, and user behaviors. Through tools such as surveys, analytics, usability metrics, and large-scale studies, it enables organizations to make evidence-based decisions grounded in statistical validation rather than assumptions.
Enables teams to replace assumptions with measurable insights, ensuring every product decision is backed by statistically validated user data and real-world evidence.
Reveals how users interact with products at scale, identifying usage patterns, drop-offs, and engagement trends across large audiences.
Tracks key indicators like task completion rates, conversion metrics, and satisfaction scores to evaluate usability and product effectiveness.
Validates concepts and features before implementation, minimizing costly design mistakes and preventing misaligned product investments.
Helps teams prioritize features and improvements based on measurable impact rather than subjective opinions or internal bias.
Collects feedback from broad, diverse user groups, ensuring findings are statistically reliable and representative.
Provides clear numerical evidence that strengthens business cases and builds confidence in UX and product recommendations.
Quantitative research plays a critical role in UI/UX by validating design decisions through measurable user data. By analyzing metrics such as click-through rates, engagement time, and completion rates, teams gain clear performance benchmarks that guide improvements with confidence and precision.
It helps identify usability gaps across larger audiences, uncovering friction points that may not surface in smaller qualitative studies. These insights empower designers to implement high-impact, data-backed enhancements that improve overall user experience and product efficiency.
Additionally, quantitative research supports continuous product evolution by tracking performance over time. By monitoring key indicators before and after design changes, teams ensure that improvements deliver tangible business outcomes while aligning with user expectations and strategic goals.


Quantitative research is the numbers side of understanding users: surveys, analytics, task completion rates, and behavioral data collected at scale and analyzed for statistically valid patterns. It answers "how many" and "how often," not "why," which is what separates it from qualitative research.
Use it when you need to validate a decision before committing budget, or when a stakeholder needs numbers to back a design recommendation. It's also the right tool once a product has enough users that patterns are measurable, rather than early on when you're still exploring what the problem even is.
It draws from structured, measurable sources: analytics events, surveys, A/B test results, click-through and conversion rates, and task completion times across a representative sample of users. The goal is data that can be run through statistical analysis, not anecdotes from a handful of interviews.
NetBramha combines platform analytics with structured surveys depending on what the question demands. A drop-off in a funnel needs event-level analytics. A question about feature preference needs a survey with a large enough sample to be reliable.
Most teams already have dashboards. What they're usually missing is someone who can tell the difference between a real pattern and statistical noise, and connect that pattern to a design decision. NetBramha treats quantitative research as an input to a specific recommendation, not a monthly report nobody reads.
When we redesigned SIXT's car rental platform, the product served customers across 130+ countries and 2,000+ locations, which meant behavioral data varied significantly by market. The redesign had to hold up at that scale, not just for a single test region.
Because the findings come from numerical, statistically analyzed data rather than a small group's opinions, results are harder to argue with in a stakeholder meeting. A sample size and a confidence interval carry more weight than "users seemed to like it."
That objectivity matters even more when your user base isn't sitting in one place. NetBramha builds sampling and analysis that account for a product being used differently by teams and customers from Austin to Amsterdam, since a pattern that holds in one market can flip entirely in another.
Quantitative studies are led by UX researcher experts and analysts who design the study, pull the data, and run the statistical analysis, not just export a spreadsheet. You get a set of validated, prioritized findings tied to specific product decisions, not a raw data dump.
Those findings feed directly into NetBramha's Strategy and Design stages, the same process behind 250+ client engagements across 25+ countries. If you want to know what your product's data is actually telling you, get in touch.